User-written IELTS example
Writing Academic Task 1 Band 6.0 Example
Original task prompt, user essay, band score, and related examples in the same report workspace.
Illustrative target band for this original model answer.
Plan your answer
Try your own response before reading the samples.
Ideas to explore
- Summarise the overall pattern: the village grew substantially between 1868 and 1994.
- Compare the stages of expansion: early development was limited, followed by growth around the centre and later in several outlying areas.
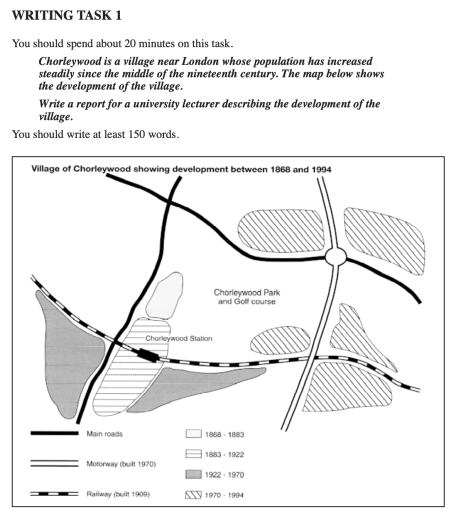
- Mention transport changes accurately: the railway was built in 1909 and the motorway in 1970; the park and golf course remained a prominent mapped feature.
Suggested structure
- Introduce the map, location and time span.
- Give an overview of the main expansion and transport-related changes.
- Describe the earliest period and development up to 1922.
- Compare the 1922–1970 and 1970–1994 periods, including the directions of later growth.
- Finish with a brief summary of the village’s expansion and continuing park and golf course.
Useful vocabulary & examples
- built-up area
- Land covered by buildings and developed settlement.
The built-up area was limited in the earliest period.
- spread around the centre
- Expanded outward in places close to the central area.
Development spread around the centre between 1883 and 1922.
- in several separate areas
- In a number of distinct locations rather than one continuous zone.
From 1970 to 1994, development appeared in several separate areas.
- transport links
- Routes or services that connect places, such as railways and motorways.
The map shows the railway and motorway as important transport links.
Task Prompt
User Essay Analysis
Review the public answer with report-style highlights.
There was a village located in the London’s suburb with stable population growth from 1868 to 1994, namely Chorleywood. The map delineates the evolving of this neighbourhood over the observed periods. Chorleywood had three types of roads: main roads, motorway, and railway. The village was divided into nine parts by these roads. The motorway and railway were added later, in 1970 and 1909 respectively. The railway runs from west to east through the village, with Chorleywood Station close to the centre, while the motorway crosses the eastern side from north to south. A major roundabout connects the motorway with a main road.
Initially, development was limited to a small central area close to the main roads. Between 1883 and 1922, the built-up area expanded around the station, particularly towards the south and west. Further growth took place from 1922 to 1970, with larger sections appearing on both sides of the railway, mainly to the west and south-east of the centre.
The most extensive expansion occurred between 1970 and 1994. New areas were established in several locations, including north of the park and golf course, east of the motorway, and south-east of the railway. Overall, Chorleywood grew from a compact settlement around its central transport routes into a more widely spread village, while the park and golf course remained in the central northern area.
Targeted Improvement Tips
Related examples for this topic
Compare different bands on the same IELTS prompt.
The provided maps illustrate the significant growth and development of the village of Chorleywood over a 126-year period, from 1868 to 1994. Overall, it is clear that the villag...
Band 8.0The map above illustrates the development of Chorleywood village from 1868 to 1994. In 1868, the village already had two main roads. One ran along the western side of the villag...
Band 7.0The map illustrates the changes in Chorleywood village beside London over the two centuries from 1868 to 1994. Overall, it is clear from the map that Chorleywood experienced dra...
Band 6.0I am glad to present my presentation about the development of a village called Chorleywood. If there are no objections, I will go ahead and get started. First of all, I would li...
Band 5.0The map provided illustrates the development of Chorleywood, which is a village near London that witnessed an increase in population in the middle of the nineteenth century. Ove...
Band 4.0The illustration demonstrates the growth of citinizens in a village near to london between 1868 to 1994. Overall, the largest increase where in the east of the village , whereas...
