User-written IELTS example
Writing Academic Task 1 Band 7.0 Example
Original task prompt, user essay, band score, and related examples in the same report workspace.
Illustrative target band for this original model answer.
Plan your answer
Try your own response before reading the samples.
Ideas to explore
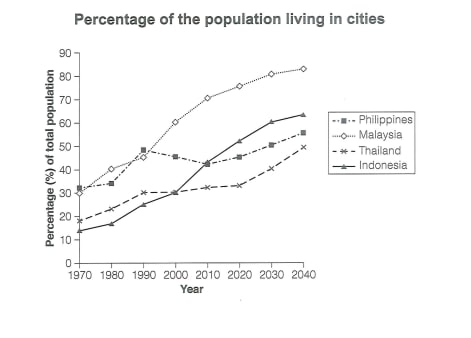
- Compare the overall upward direction with differences in pace: Malaysia rises steadily, while Indonesia’s growth accelerates after 2000.
- Highlight meaningful exceptions to a simple upward trend, especially the Philippines’ fall after 1990 and Thailand’s extended plateau.
- Use the final-year figures to compare the projected ranking: Malaysia is highest, Indonesia next, the Philippines below it, and Thailand lowest.
Suggested structure
- Paraphrase the graph’s subject, countries, and time span in the introduction.
- Give an overview of the overall direction and the main contrast in projected levels.
- Describe starting values and Malaysia’s steady rise.
- Compare the Philippines’ dip and recovery with Indonesia’s stronger later growth.
- Finish the detailed comparison with Thailand’s plateau and forecast increase.
Useful vocabulary & examples
- urban population share
- the percentage of a population living in cities
Malaysia’s urban population share is projected to exceed 80% by 2040.
- reach a peak
- attain the highest point in a period
The Philippines reached a peak of about 48% in 1990.
- remain broadly stable
- stay at a similar level, with little overall change
Thailand’s figure remained broadly stable near 30% for several years.
- be projected to
- be expected or forecast to happen
Indonesia’s urban share is projected to reach about 64% in 2040.
Task Prompt
User Essay Analysis
Review the public answer with report-style highlights.
The provided line graph illustrates the urban population percentages of the Philippines, Malaysia, Thailand, and Indonesia from 1970 to 2020, with projections for 2030 and 2040. Overall, the Philippines had the highest urban population percentages, with a substantial increase from 1970 to 2040. In contrast, Indonesia had the lowest urbanization rate, while Malaysia and Thailand showed different trends. In 1970, the Philippines stood at about 32%, compared with roughly 30% in Malaysia, 18% in Thailand and 13% in Indonesia. The figures later in the period, however, do not support the claim that Indonesia had the lowest rate throughout: it began lowest but climbed rapidly, becoming the second-highest country by 2040. Malaysia increased steadily, reaching 60% in 2000 and around 83% in 2040, the highest figure shown. Indonesia also rose sharply, from about 30% in 2000 to 64% by 2040. The Philippines peaked at just under 50% in 1990, fell to around 43% in 2010, then recovered to approximately 56% in 2040. Thailand grew more gradually, remaining near 30–33% between 1990 and 2020 before rising to 50% in 2040. Thus, Malaysia led from 2000 onward, while Thailand had the lowest projected figure at the end.
Targeted Improvement Tips
Related examples for this topic
Compare different bands on the same IELTS prompt.
The following report presents information on the urban population percentages in the Philippines, Malaysia, Thailand, and Indonesia from 1970 to 2040, as depicted in the provide...
Band 8.0The line graph provides a visual representation of the percentage of urban population in four Asian countries from 1970 to 2040, with projections for 2030 and 2040. Overall, the...
Band 7.0The graph illustrates the proportions of people living in urban areas in four different countries in Asia between 1970 and 2020, along with projections for 2030 and 2040. Overal...
Band 6.0This table provides information on the changes in the urban population ratios of four Asian countries from 1970 to 2020, and also predicts the data on urban population ratio cha...
Band 5.0The graph provides us with information about the proportion of the population in Philippines, Malaysia, Thailand and Indonesia living in cities from 1970 till 2020, with predict...
Band 4.0The graph shows percentage of the population in four Asian countries living in cities from 1970 to 2020, with predictions for 2030 and 2040. The number of population to Philippi...
