User-written IELTS example
Writing Academic Task 1 Band 9.0 Example
Original task prompt, user essay, band score, and related examples in the same report workspace.
Illustrative target band for this original model answer.
Plan your answer
Try your own response before reading the samples.
Ideas to explore
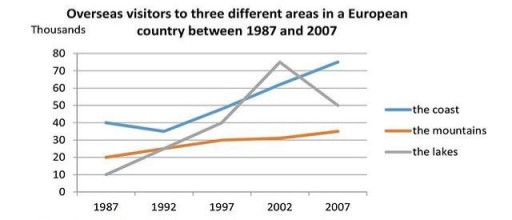
- The coast grows overall despite a small dip between 1987 and 1992, then finishes with the highest visitor total.
- The lakes show the largest fluctuation: a sharp rise to a 2002 peak followed by a substantial fall.
- The mountains remain the least visited area at the end, but their numbers increase gradually rather than decline.
Suggested structure
- Introduce the graph, its subject, locations and time period.
- Give an overview of the broad trends, the lakes’ peak and the final ranking.
- Describe the coast’s starting point, brief decline and subsequent rise.
- Compare the mountains’ steady increase with the lakes’ rise and later fall.
Useful vocabulary & examples
- rose steadily
- increased gradually over a period
Visitor numbers for the mountains rose steadily from about 20,000 to 35,000.
- peaked at
- reached the highest point
The number of visitors to the lakes peaked at approximately 75,000 in 2002.
- fell to
- decreased and reached a particular level
The lakes’ figure fell to around 50,000 by 2007.
- ended as the most popular destination
- had the highest visitor figure at the end of the period
The coast ended as the most popular destination, at about 75,000 visitors.
Task Prompt
User Essay Analysis
Review the public answer with report-style highlights.
The line graph illustrates the number of overseas visitors to three distinct regions—coast, mountains, and lakes—within a European country over a two-decade period from 1987 to 2007. Overall, while the coast and lakes experienced significant growth in visitor numbers, the mountains witnessed a notable decline, particularly from the early 2000s onwards. In terms of the detailed figures, however, the mountain trend is different from the overview above: visitor numbers rose steadily rather than falling. The coast received about 40,000 visitors in 1987, before its figure dipped to 35,000 in 1992. It then rose to around 45,000 in 1997, 60,000 in 2002 and 75,000 in 2007, the highest final figure. Numbers for the mountains increased from approximately 20,000 to 25,000 and then 30,000 between 1987 and 1997. They remained at around 30,000 in 2002 before reaching 35,000 at the end. The lakes began with the fewest visitors, at about 10,000, but climbed to 40,000 by 1997 and peaked at approximately 75,000 in 2002. Their figure then fell to 50,000 in 2007. Thus, the coast finished first, followed by the lakes and then the mountains.
Targeted Improvement Tips
Related examples for this topic
Compare different bands on the same IELTS prompt.
The line graph presents data regarding the number of overseas visitors to three distinct regions – the coast, mountains, and lakes – in a European country over a 20-year period,...
Band 8.0The line graph elucidates the trends in international tourism within a European nation, tracking the visitor numbers to the coast, mountains, and lakes over two decades, commenc...
Band 7.0Provided is the line graph illustrating the number of foreigners traveling to three separate regions namely the coast, the mountains and the lakes in Europe over the periods of...
Band 6.0The presented flow graph illustrates the number of overseas tourist to the coast, the mountains and the lakes in a country in Europe, from 1987 to 2007. At the first glance, it...
Band 5.0The line chart illustrates the amount of tourist that visited three different areas in a European country from 1987 to 2007. Overall, all these areas witnessed an increase in th...
Band 4.0As we can see, the line graph depicts the amount of international tourists to different areas in a European nation in the period between 1987-2007. A glance at the graph reveals...
