User-written IELTS example
Writing Academic Task 1 Band 4.0 Example
Original task prompt, user essay, band score, and related examples in the same report workspace.
Illustrative target band for this original model answer.
Plan your answer
Try your own response before reading the samples.
Ideas to explore
- Identify the overall direction of each line separately: margarine and butter fall over the full period, while the low-fat variety rises after it appears and then declines.
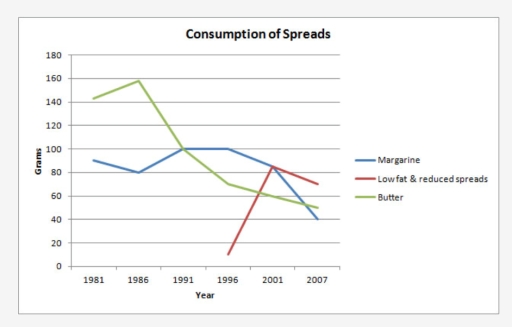
- Highlight key turning points: butter peaks in 1986, margarine reaches a plateau around 100 grams in 1991–1996, and the low-fat line surges by 2001.
- Mention crossovers where they change the ranking: Low Fat & Reduced Spreads is highest in 2001, while butter and margarine are no longer the leading series.
Suggested structure
- Introduce the graph, naming all three spreads, the years and the unit.
- Give an overview that accurately summarises the different overall patterns and the late-period ranking.
- Describe butter and margarine together, using their start values, peaks or plateaus and final values.
- Describe the later-starting low-fat series and compare its 2001 peak with the other spreads.
Useful vocabulary & examples
- reached a peak of
- rose to its highest recorded value
Butter reached a peak of approximately 160 grams in 1986.
- remained stable at
- stayed at approximately the same level
Margarine consumption remained stable at around 100 grams from 1991 to 1996.
- overtook both alternatives
- became higher than the other two series
Low Fat & Reduced Spreads overtook both alternatives in 2001.
- eased to
- fell slightly or gradually to a lower value
The low-fat spread eased to about 70 grams by 2007.
Task Prompt
User Essay Analysis
Review the public answer with report-style highlights.
The line graph illustrates information about the consumption of spreads between 1981 and 2007 Overall, the was a huge decline of butter consumtion, from 1986 to 2007, lowfat and reeuced spreads showed a little change between 1996 and 2007. the consumption of margrine declined through years. Firstly, in 1981 the consumption of butter showed about 140 grams. It then increased to approximately 160 grams in 1986, before falling to 100 grams in 1991. After this, butter continued to go down, reaching about 70 grams in 1996 and around 50 grams at the end of the period. In comparison, margarine started at 90 grams and decreased slightly to 80 in 1986. It rose again to 100 grams in 1991, and stayed at this level until 1996. After 1996, it went down, first to about 85 in 2001 and then 40 grams in 2007. The lowfat and reduced spread was not shown before 1996, when it was only 10 grams. It then rose very quickly to about 85 grams in 2001, becoming higher than the other spreads. In 2007, it decreased to 70 grams, while butter and margarine were lower. More specifically, the red line changed considerably overall, despite the earlier description of little change.
Targeted Improvement Tips
Related examples for this topic
Compare different bands on the same IELTS prompt.
The line graph illustrates the trends in the consumption of three types of spreads—Margarine, Low Fat & Reduced Spreads, and Butter—from 1981 to 2007. Overall, the data indicate...
Band 8.0The graph illustrates the consumption of three types of spreads (margarine, butter, and low-fat spreads) from 1981 to 2007 in grams. Overall, butter consumption started high but...
Band 7.0The line graph illustrates the amount of three kinds of spreads(margarine, low fat and reduced spreads and butter) which were consumed over 26 years from 1981 to 2007. Units are...
Band 6.0The bar chart provides information about the percentage of births and deaths in Switzerland between 1970 and 2020, based on United Nations statistics. Overall,it is clear that t...
Band 5.0The percentages of employed women in the four countries between 1985 and 2005 are demonstrated in the line graph. Overall , what stands out from the graph is that all of the cou...
Band 4.0The given graph illustrates the consumption of three variation of foods (margarine, low fat and reduced spreads and butter) between 1981 and 2007. In overall, we can see on the...
