User-written IELTS example
Writing Academic Task 1 Band 8.0 Example
Original task prompt, user essay, band score, and related examples in the same report workspace.
Illustrative target band for this original model answer.
Plan your answer
Try your own response before reading the samples.
Ideas to explore
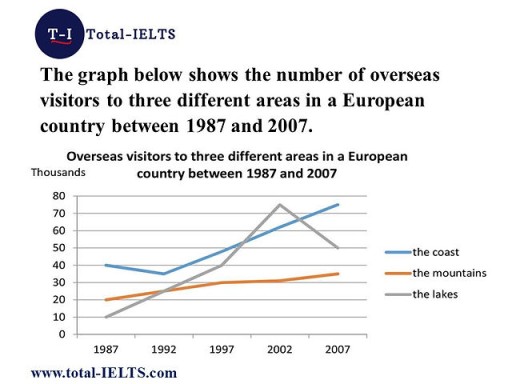
- The coast begins as the leading destination, dips slightly in 1992, then rises to finish highest.
- Mountain visitor numbers rise gradually, with little change between 1997 and 2002.
- The lakes have the most pronounced movement: a steep climb to the 2002 peak followed by a substantial fall.
Suggested structure
- Introduce the chart, locations, unit and period.
- Summarise the overall trends and identify the standout peak or change in ranking.
- Describe the coast’s figures in time order.
- Compare the more gradual mountain trend with the lakes’ sharper rise and fall.
Useful vocabulary & examples
- rose steadily
- increased gradually over time
Coastal visitor numbers rose steadily after 1992.
- remained close to this level
- stayed approximately the same
The mountain figure remained close to 30,000 in 2002.
- peaked at
- reached its highest point at a particular value
The number of visitors to the lakes peaked at around 75,000 in 2002.
- fell to
- decreased until it reached a stated value
Lake visits fell to 50,000 by 2007.
Task Prompt
User Essay Analysis
Review the public answer with report-style highlights.
The line graph illustrates the variations in the number of international tourists who visited three distinct locations in a European country from 1987 to 2007. Overall, coastal areas experienced the highest influx of foreign visitors throughout the period, with a consistent upward trend in tourist numbers. In contrast, mountainous areas recorded the fewest tourists, while the lakes showed the most dramatic rise and subsequent fall. In 1987, the coast attracted about 40,000 visitors, compared with roughly 20,000 to the mountains and 10,000 to the lakes. Five years later, coastal visitor numbers dipped slightly to around 35,000, while both the mountain and lake figures stood at approximately 25,000. By 1997, the coast had recovered to 50,000, and the number visiting the lakes had increased to 40,000; the mountains reached about 30,000. The most striking change occurred in the lakes, whose visitor total surged to approximately 75,000 in 2002, exceeding the coast at about 65,000. By 2007, the coastal figure had climbed to around 75,000, whereas the lake total fell to 50,000. Mountain visits rose more gradually, ending at roughly 35,000.
Targeted Improvement Tips
Related examples for this topic
Compare different bands on the same IELTS prompt.
The line graph presented illustrates the trends in overseas visitors to three distinct regions – coast, mountains, and lakes – within a European country over a two-decade span f...
Band 8.0The line graph provided illustrates the number of overseas visitors to three distinct areas within a European country over a span of two decades, from 1987 to 2007. Overall, it...
Band 7.0The graph illustrates the number of foreign tourists who visit the coast, the mountains and the lakes in a European country over a 20-year period from 1987 to 2007. Overall, mos...
Band 6.0The line graph gives information about how many overseas visitors travel to three different areas over a period of 20 years in a European country. It is clear that total number...
Band 5.0The line graph displays the number of international tourists visiting the coast , the mountains, and the lake in Europe in the last 20 years. Overall, it is clear that, the visi...
Band 4.0The line graph compares and contrasts in changes of how many people travelled to the coast, the mountains and the lakes in a European country over a 20-year period from 1987 to...
