User-written IELTS example
Writing Academic Task 1 Band 9.0 Example
Original task prompt, user essay, band score, and related examples in the same report workspace.
Illustrative target band for this original model answer.
Plan your answer
Try your own response before reading the samples.
Ideas to explore
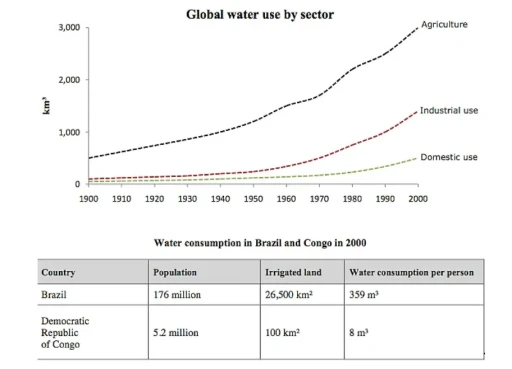
- Agriculture is the largest global water-use sector across the displayed period, rising to about 3,000 km³ by 2000.
- Industrial and domestic use both increase over time, but remain below agricultural use; industry ends at roughly 1,400 km³ and domestic use at about 500 km³.
- In 2000, Brazil exceeds the Democratic Republic of Congo in population, irrigated land and per-person water consumption; the per-person figures are 359 m³ and 8 m³ respectively.
Suggested structure
- Introduce the line graph and table, including their subject and time point.
- Give an overview of the dominant global sector and the main country contrast.
- Describe the global trend, comparing agriculture, industry and domestic use from the start to the end of the period.
- Summarise the table by comparing population, irrigated land and per-person consumption.
Useful vocabulary & examples
- per-person consumption
- The amount used by each individual on average.
Per-person water consumption was 359 m³ in Brazil.
- irrigated land
- Land supplied with water artificially to support crop growth.
Brazil had 26,500 km² of irrigated land.
- rose from … to …
- A concise way to describe an increase between two figures.
Agricultural water use rose from about 500 km³ to approximately 3,000 km³.
- remained the smallest category
- Continued to be the lowest of the compared groups.
Domestic use remained the smallest category in the graph.
Task Prompt
User Essay Analysis
Review the public answer with report-style highlights.
The graph and table provide information about global water usage by sector from 1900 to 2000, and the water consumption statistics for Brazil and the Democratic Republic of Congo in 2000. The graph illustrates the trends in water use across three sectors: agriculture, industrial, and domestic. Over the 20th century, agricultural water use consistently accounted for the largest share. Overall, water use rose in all three sectors, with agriculture remaining the biggest user throughout. The table also shows that Brazil had a larger population, more irrigated land and higher per-person water consumption than the Democratic Republic of Congo.
In 1900, agriculture used approximately 500 km³ of water, compared with around 100 km³ for industry and 50 km³ for domestic purposes. Agricultural use rose steadily before increasing more sharply from about 1950, reaching roughly 3,000 km³ by 2000. Industrial consumption also accelerated in the latter part of the period, ending at about 1,400 km³. Domestic use increased more gradually, to approximately 500 km³.
In 2000, Brazil had a population of 176 million and 26,500 km² of irrigated land. The corresponding figures for the Democratic Republic of Congo were 5.2 million people and 100 km². Per-person consumption was 359 m³ in Brazil, far above the 8 m³ recorded in Congo.
Targeted Improvement Tips
Related examples for this topic
Compare different bands on the same IELTS prompt.
The provided charts elucidate the global distribution of water utilization across various sectors, while concurrently offering a comparative analysis of water consumption in Bra...
Band 8.0The line graph shows global water consumption in three different sectors between 1900 and 2000, while the table compares water use in Brazil and the Democratic Republic of Congo...
Band 7.0The line graph illustrates three sectors in terms of the amount of water that they used in the world between 1900 and 2000, while the table gives information about water expendi...
Band 6.0The provided graph and table illustrate the water usage worldwide and consumption in two different countries. Overall, the global water usage has increased significantly in all...
Band 5.0The given line graph and table provide data on regarding how much water was used in all over the world from 1900 to 2000 and in two countries. In general, a glance at the line g...
Band 4.0The line graph compares the amount of usage of water globally in three sectors over a hundred year period, while the table illustrates the consumption of water by Brazil and Con...
