



AI-completed learning example
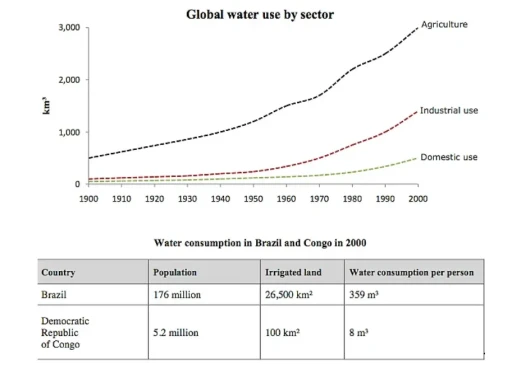
200 words · Illustrative target bandThe line graph shows global water consumption in three different sectors between 1900 and 2000, while the table compares water use in Brazil and the Democratic Republic of Congo in 2000. Overall, water consumption increased in all three sectors but agriculture consumed far more water than the other two. Brazil was a much bigger water user per person than the Democratic Republic of Congo, and it also had a much larger…
Read full answer & analysis →