

Task 1 · line graph · 18 samples

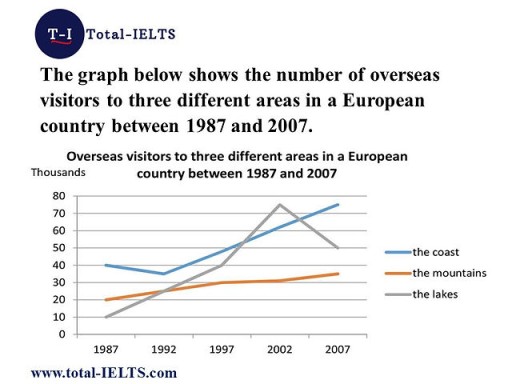
The graph below shows the number of overseas visitors to three different areas in a European country between 1987 and 2007.

Data or diagram for the writing questionPractise this task →

Plan your answer

Try your own response before reading the samples.

Ideas to explore

  • The coast begins as the leading destination, dips slightly in 1992, then rises to finish highest.
  • Mountain visitor numbers rise gradually, with little change between 1997 and 2002.
  • The lakes have the most pronounced movement: a steep climb to the 2002 peak followed by a substantial fall.

Suggested structure

  1. Introduce the chart, locations, unit and period.
  2. Summarise the overall trends and identify the standout peak or change in ranking.
  3. Describe the coast’s figures in time order.
  4. Compare the more gradual mountain trend with the lakes’ sharper rise and fall.
Useful vocabulary & examples
rose steadily
increased gradually over time

Coastal visitor numbers rose steadily after 1992.

remained close to this level
stayed approximately the same

The mountain figure remained close to 30,000 in 2002.

peaked at
reached its highest point at a particular value

The number of visitors to the lakes peaked at around 75,000 in 2002.

fell to
decreased until it reached a stated value

Lake visits fell to 50,000 by 2007.

Sample answers

AI-completed learning example

226 words · Illustrative target band

The line graph compares and contrasts in changes of how many people travelled to the coast, the mountains and the lakes in a European country over a 20-year period from 1987 to 2007. A closer look at the diagram highlights the fact that the three attractions seemed to be favored by the visitors as they visited these areas. Overall, the coast was the most popular place in 1987 and 2007, while the lakes had the highest…

Read full answer & analysis →

AI-completed learning example

195 words · Illustrative target band

The line graph compares three varied areas in Europe in term of tourism by amount of countryside visitors from 1987 and 2007. Overall, the lakes area reached the highest peak by the numbers of overseas visitors, and the mountains remained at this level in whole duration, but finally the coast area was by far most popular destination in 2007, at approximately 75,000 visitors. In 1987, the coast was already the most vi…

Read full answer & analysis →

AI-completed learning example

220 words · Illustrative target band

The line graph illustrates amount of foreign visitors to three various zones in a European country from 1987 and 2007. Overall it is clear that all three zones shown on the graph experienced varying degrees of increase in the thousands of tourists over the period given. We can also see that the biggest rise was seen in the lakes, where the number of visitors went up very quickly until 2002. In 1987, the coast was the…

Read full answer & analysis →