

Task 1 · pie chart · 18 samples

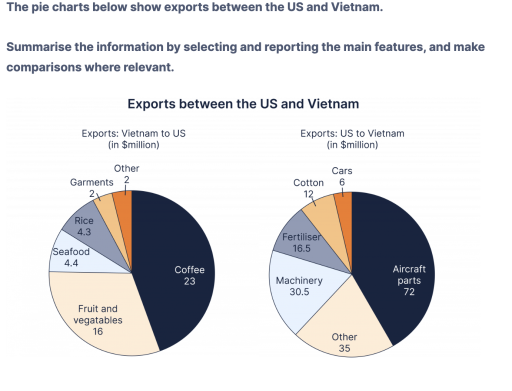
The pie charts below shows exports between the US and Vietnam

Data or diagram for the writing questionPractise this task →

Plan your answer

Try your own response before reading the samples.

Ideas to explore

  • Compare the largest category in each direction: aircraft parts are $72 million from the US to Vietnam, while coffee is $23 million from Vietnam to the US.
  • Highlight the gap between the leading and smaller categories: US exports include other goods at $35 million and machinery at $30.5 million, while Vietnam’s garments and other exports are both $2 million.
  • Point out close values where they help summarise the data: Vietnam’s seafood ($4.4 million) and rice ($4.3 million) are almost equal.

Suggested structure

  1. Paraphrase what the charts compare and state that values are in millions of dollars.
  2. Give an overview naming the leading category in each direction and any notable tie or overall contrast.
  3. Describe US-to-Vietnam exports from the largest value to the smallest.
  4. Describe Vietnam-to-US exports in descending order, grouping the close seafood and rice figures and the tied lowest figures.
Useful vocabulary & examples
account for
to make up or represent a stated amount or share

Aircraft parts account for $72 million of exports to Vietnam.

be valued at
to have a stated monetary value

Machinery is valued at $30.5 million.

be tied at
to have the same value as another category

Garments and other exports are tied at $2 million.

followed by
used to introduce the next item in a ranking

Coffee leads at $23 million, followed by fruit and vegetables at $16 million.

Sample answers

AI-completed learning example

185 words · Illustrative target band

The pie charts compare the export figures of the US and Vietnam. Units are in million US dollars. Overall, while the most exported item from Vietnam to the US is coffee, the US primarily exports aircraft parts to Vietnam. Notably, the volume of US exports to Vietnam far exceeds that of Vietnam exports to the US, at 172 million dollars compared with Vietnam's 51.7 million. The charts show that aircraft parts alone acc…

Read full answer & analysis →

AI-completed learning example

190 words · Illustrative target band

The given pie chart illustrates commodities exported in units of a million United States Dollars ($), between the United States and Vietnam. Overall, the exports from the United States exceed those of Vietnam by a little more than three times in terms of gross revenue. Moreover, the United States is majorly selling mechanical items or aircraft parts, with exports in this category reaching $72 million. Other goods wer…

Read full answer & analysis →

AI-completed learning example

204 words · Illustrative target band

The two pie charts presents information about the different items being exported between the US and Vietnam, measured in millions of dollars. Overall, it is evident that the US exports a larger amount to Vietnam than Vietnam exports to the US, with a striking difference of $120,3 million. The biggest export from the US is aircraft parts, at $72 million, while coffee is the leading Vietnamese export to the US, at $23 …

Read full answer & analysis →