

Task 1 · multiple graphs · 18 samples

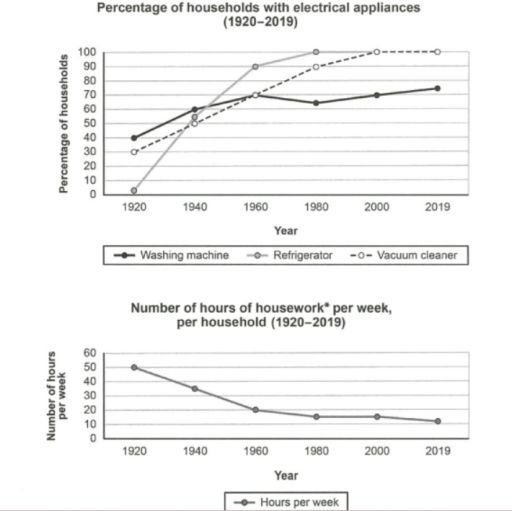
The charts below show the changes in ownership of electrical appliances and amount of time doing housework and households in one country between 1920 and 2019. Summarise the information by selecting and reporting the main features, and make comparisons where relevant.

Data or diagram for the writing questionPractise this task →

Plan your answer

Try your own response before reading the samples.

Ideas to explore

  • Compare the pace of adoption: refrigerator ownership rose especially quickly between 1940 and 1960, while washing-machine ownership changed more gradually.
  • Identify milestones in appliance ownership: refrigerators reached 100% by 1980, and vacuum cleaners did so by 2000.
  • Set the decline in housework hours alongside rising appliance ownership, while avoiding claims that the charts prove one trend caused the other.

Suggested structure

  1. Introduce both charts, the measures shown and the 1920–2019 period.
  2. Give an overview of the broad appliance-ownership increases and the fall in housework hours.
  3. Compare the three appliances, highlighting their starting points and the years they reached universal ownership.
  4. Describe the housework-hour decline chronologically, noting the plateau at 15 hours between 1980 and 2000.
Useful vocabulary & examples
household ownership
the proportion of households that have a particular item

Household ownership of refrigerators rose to 100% by 1980.

reach universal ownership
be owned by all households shown in the chart

Vacuum cleaners reached universal ownership in 2000.

edge down
decrease slightly

Washing-machine ownership edged down between 1960 and 1980.

remain at that level
stay unchanged at a previously stated figure

Housework time remained at 15 hours per week from 1980 to 2000.

Sample answers

AI-completed learning example

201 words · Illustrative target band

The line graph illustrates the different electrical appliances percentage in households as well as number of hours needed in per week for work at home in a country from 1920 to 2019. Overall the electrical device like washing machine, refrigerator and vacuum cleaner used gradually increase within 99 years whereas working in house time was decreased from 50 hours per week in 1920 to about 10 hours in 2019. It fell to …

Read full answer & analysis →

AI-completed learning example

224 words · Illustrative target band

The provided chart clearly depicts the modifications of the total duration consumed during dealing with variety of devices in homes plus the ownership of devices which rely on electricity between 11920 and 2019. It is obviously show that cooling device was fully unknown throughout early 20’s However it had a rapid increase of ownership in later years. Overall, the ownership of all three appliances went up, while the …

Read full answer & analysis →

AI-completed learning example

212 words · Illustrative target band

The provided line charts give statistical analysis about the alternation in possession of electronic gadgets as well as the quantity of time used for household chores in a specific nation from 1920 to 2019. Overall, the ownership of refrigerators and vacuum cleaners increased constantly and reached a peak in the final years while that of washing machines also went up, but it had a small fall in 1980. The hours of hou…

Read full answer & analysis →