

Task 1 · multiple graphs · 18 samples

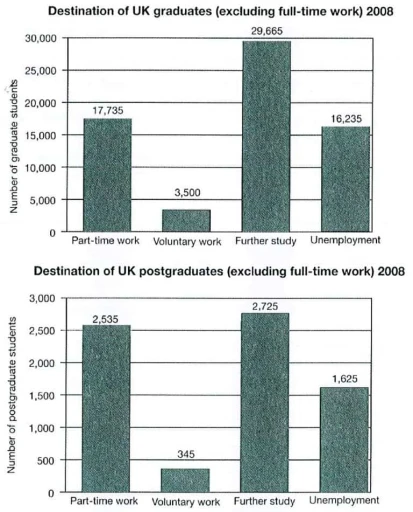
The charts below show what UK graduate and postgraduate students who did not go into full-time work did after leaving college in 2008. Summarize the information by selecting and reporting the main features, and make comparisons where relevant.

Data or diagram for the writing questionPractise this task →

Plan your answer

Try your own response before reading the samples.

Ideas to explore

  • Further study was the leading destination for both graduates and postgraduates.
  • Voluntary work was the least common option in each group.
  • Graduate counts exceeded postgraduate counts in all four categories, with the biggest absolute difference in further study.

Suggested structure

  1. Paraphrase the chart topic and specify the year and population.
  2. Give an overview of the shared highest and lowest categories.
  3. Report graduate figures in rank order, grouping the leading choices and the smaller categories.
  4. Report postgraduate figures in the same order to make comparisons easy.
  5. Close with the most notable difference between the two groups.
Useful vocabulary & examples
the most common destination
The option chosen by the largest number of people.

Further study was the most common destination for both groups.

ranked second
Was the second-highest category in a set of figures.

Part-time work ranked second for graduates.

by contrast
A linking phrase used to introduce a noticeably different figure or fact.

By contrast, only 3,500 graduates undertook voluntary work.

the largest difference
The greatest gap between two compared figures.

The largest difference between the groups was in further study.

Sample answers

AI-completed learning example

186 words · Illustrative target band

The bar charts provides information about what Uk Bachelor’s and Master’s degree graduates did after finishing college beside getting a full time job in 2008. Overall, it seems that most graduate students preferred to continue their education,whereas doing voluntary work was the least popular option among students. Looking specifically at Uk graduates, approximately 30 000 people chose further study, making this the …

Read full answer & analysis →

AI-completed learning example

184 words · Illustrative target band

The bar graph provide information about graduate and post graduate pupils who did not go into full time work did after finishing their study in the United Kingdom in the year 2008. Overall, it is evident that the number of students destination of uk graduate and post graduate in futher study were highest, whereas the figures for voluntary work were the lowest for both groups. For graduates, 29,665 went on to further …

Read full answer & analysis →

AI-completed learning example

200 words · Illustrative target band

The chart below represents the number of graduates and post graduates and their preferences in the fields other than a full-time work such as part-time work, Voluntary work, further studies and who stays unemployed in the year 2008. We see that over 29,000 graduate students which is the highest number pursue further studies after completing their studies. Overall, further study was by far the most common destination …

Read full answer & analysis →