

Task 1 · multiple graphs · 18 samples

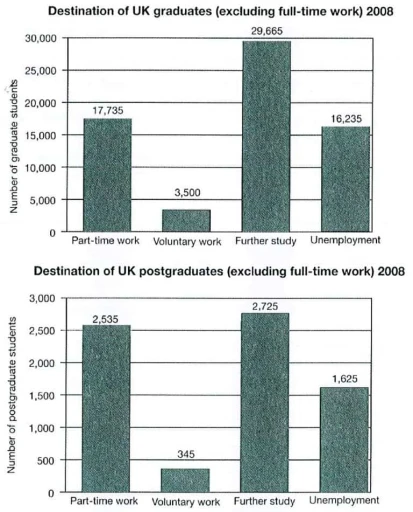
The charts below show what UK graduate and postgraduate students who did not go into full-time work did after leaving college in 2008. Summarize the information by selecting and reporting the main features, and make comparisons where relevant.

Data or diagram for the writing questionPractise this task →

Plan your answer

Try your own response before reading the samples.

Ideas to explore

  • Further study was the leading destination for both graduates and postgraduates.
  • Voluntary work was the least common option in each group.
  • Graduate counts exceeded postgraduate counts in all four categories, with the biggest absolute difference in further study.

Suggested structure

  1. Paraphrase the chart topic and specify the year and population.
  2. Give an overview of the shared highest and lowest categories.
  3. Report graduate figures in rank order, grouping the leading choices and the smaller categories.
  4. Report postgraduate figures in the same order to make comparisons easy.
  5. Close with the most notable difference between the two groups.
Useful vocabulary & examples
the most common destination
The option chosen by the largest number of people.

Further study was the most common destination for both groups.

ranked second
Was the second-highest category in a set of figures.

Part-time work ranked second for graduates.

by contrast
A linking phrase used to introduce a noticeably different figure or fact.

By contrast, only 3,500 graduates undertook voluntary work.

the largest difference
The greatest gap between two compared figures.

The largest difference between the groups was in further study.

Sample answers

AI-completed learning example

179 words · Illustrative target band

The charts illustrate the various destinations of UK graduate and postgraduate students who did not enter full-time employment after graduating in 2008. For graduates, the majority pursued further education, with 29,665 individuals choosing this path. Part-time work was the second most common option, with 17,735 graduates opting for this. A notable number of graduates, around 16,235, were unemployed. In comparison, o…

Read full answer & analysis →

AI-completed learning example

219 words · Illustrative target band

The first bar chart demonstrates the data about the decisions of UK graduates after finishing college in 2008, while the second chart shows the destinations of UK postgraduates in the same year. In a general perspective, as is clear from the given charts, the number of graduate and postgraduate students who were unemployed after college was considerably higher among graduates than among postgraduates. Overall, furthe…

Read full answer & analysis →

AI-completed learning example

208 words · Illustrative target band

The provided charts illustrate the post-collegiate paths of UK graduate and postgraduate students who did not enter full-time employment in 2008. A significant disparity is evident between the destinations of graduates and postgraduates, with a notably higher proportion of graduates pursuing further study compared to their postgraduate counterparts. Focusing on the destinations of graduates, the largest number chose …

Read full answer & analysis →