

Task 1 · map · 18 samples

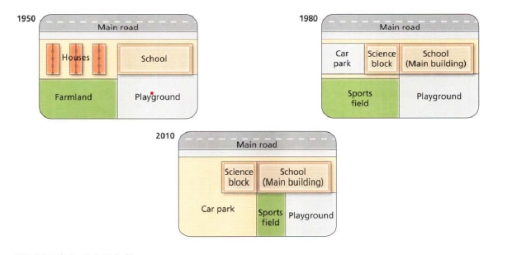
The diagram below show the changes that have taken place at West park secondary school since its construction in 1950. Summarize the information by selecting and reporting main features and make comparisons while relevant.

Data or diagram for the writing questionPractise this task →

Plan your answer

Try your own response before reading the samples.

Ideas to explore

  • Trace how the western side changed from houses and farmland to a car park and sports field, then to an expanded car park and smaller sports field.
  • Note that the science block appears by 1980, while the main school building stays in the northeastern area.
  • Identify features that remain broadly stable across the maps, including the main road along the northern boundary and the playground in the southeast.

Suggested structure

  1. Introduce the dates and identify the maps as changes to the school site.
  2. Give an overview of the main redevelopment and the features that remain.
  3. Describe the 1950 layout using clear directional references.
  4. Compare the main additions and replacements in 1980 and 2010.
  5. End with the most notable change, such as the car park’s expansion and the sports field’s reduction.
Useful vocabulary & examples
occupy the western side
be located across the western part of a site

By 2010, the car park occupied most of the western side.

be replaced by
be removed and have something else put in its place

The houses and farmland were replaced by facilities for parking and sport.

expand southwards
increase in size toward the south

The car park expanded southwards between 1980 and 2010.

remain in the northeastern area
stay broadly in the northeast part of a location

The main school building remained in the northeastern area of the site.

Sample answers

AI-completed learning example

207 words · Illustrative target band

The maps illustrate how West Park Secondary School has transformed over time, 1950, 1980, and 2010. Overall, it can be seen that the school had undergone some significant changes over this period with the expansion of the school building, as well as the addition of sports field and car park. From the diagrams, the first map shows the site in 1950, when houses occupied the north-west corner, farmland lay directly belo…

Read full answer & analysis →

AI-completed learning example

194 words · Illustrative target band

The diagram represents how West Park Secondary School changed over the years since its construction in 1950. Overall, the school and playground have remained in their original state since their opening in 1950. However, on today’s map, we see that a new additional building called Science Block has been built, and the size of the car park and sports areas have also changed. In 1950, houses occupied the north-western s…

Read full answer & analysis →

AI-completed learning example

185 words · Illustrative target band

The diagram illustrates the differences in West Park Secondary School’s constructions in 1950, 1980 and 2010. Overall, through a 60 year period, the West Park Secondary School had changed in buildings and expansion. However, the location of the main building of the school was constant. From 1950 to 1980, there were changes in buildings as the houses and farmland were removed and replaced by new facilities. By 1980, t…

Read full answer & analysis →