



AI-completed learning example
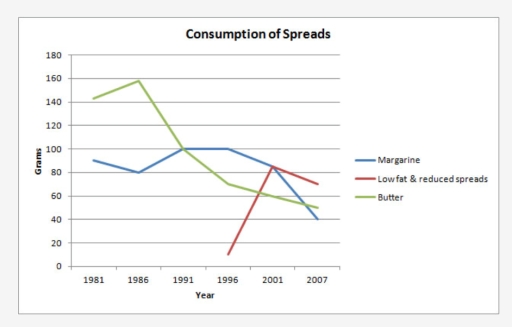
214 words · Illustrative target bandThe line graph illustrates the amount of three kinds of spreads(margarine, low fat and reduced spreads and butter) which were consumed over 26 years from 1981 to 2007. Units are measured in grams. Overall, the consumption of margarine and butter decreased over the period given, while for low fat and reduced spreads, it rose. At the start of the period, butter was the most popular spread, at about 140 grams, compared …
Read full answer & analysis →