



AI-completed learning example
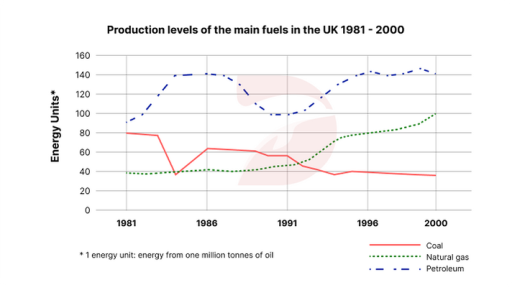
231 words · Illustrative target bandThe supplied graph illustrates the production levels of the main types of fuel in the United Kingdom from 1981 to 2000. Looking from an overall perspective, it is readily apparent that there are a total of 3 main lines representing three types of fuel with comparison to energy units: coal, natural gas, and petroleum. The three fuels are measured in energy units, with each unit representing the energy from one million…
Read full answer & analysis →