



AI-completed learning example
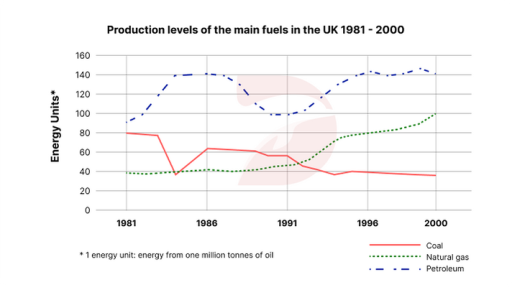
193 words · Illustrative target bandThe chart presents a comprehensive overview of the production trends of three primary fuel sources in the United Kingdom over a period of 19 years starting from 1981. The overall pattern exhibits a notable shift in the dominance of fuel sources over the two-decade period, with natural gas experiencing a dramatic surge, coal production undergoing a marked decline overall. Petroleum was the leading fuel throughout the…
Read full answer & analysis →