



AI-completed learning example
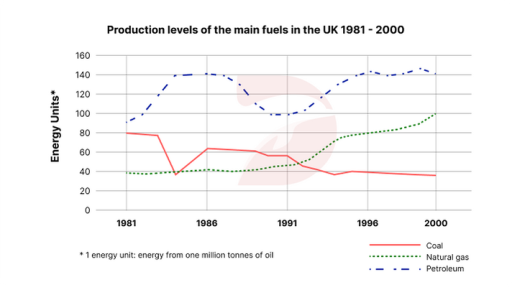
197 words · Illustrative target bandThe displayed line graph depicts the volume of the premier fuels produced in the United Kingdom from 1981 to 2000. Looking at the details, there was a dramatic decrease in use of petroleum and coal for certain periods, while natural gas’s usage has experienced a stable rise. In 1981, about 95,000,000 tonnes of petroleum was produced, and its output then rose sharply to around 140 energy units by the middle of the dec…
Read full answer & analysis →