

Task 1 · pie chart · 18 samples

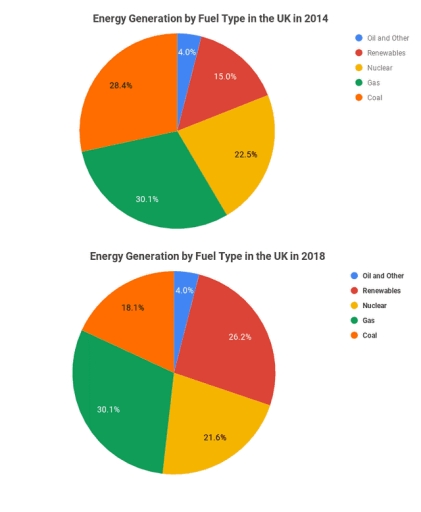
The pie chart below shows the energy generation by fuel type in the UK over two years. Summarize the information by selecting and reporting the main features, and make comparisons where relevant

Data or diagram for the writing questionPractise this task →

Plan your answer

Try your own response before reading the samples.

Ideas to explore

  • Renewables rose from 15.0% in 2014 to 26.2% in 2018, the most notable increase.
  • Coal fell from 28.4% to 18.1%, while nuclear declined slightly from 22.5% to 21.6%.
  • Gas remained the largest category at 30.1% in both years; Oil and Other stayed at 4.0%.

Suggested structure

  1. Introduce the two pie charts, the UK, the years and the percentage measure.
  2. Give an overview highlighting the main increase, the main decrease and stable categories.
  3. Compare the 2014 shares, grouping the larger sources before the smaller ones.
  4. Describe the 2018 figures and directly compare them with 2014.
Useful vocabulary & examples
accounted for
made up a particular proportion of the total

Gas accounted for 30.1% of energy generation in both years.

remained unchanged
stayed at the same level

The share for Oil and Other remained unchanged at 4.0%.

recorded the largest increase
showed the biggest rise in the figures

Renewables recorded the largest increase between 2014 and 2018.

fell by 10.3 percentage points
decreased by the difference between two percentage values

Coal fell by 10.3 percentage points, from 28.4% to 18.1%.

Sample answers

AI-completed learning example

186 words · Illustrative target band

The pie chart provides key information about power generation from different types in the United kingdom during two years. The units are measuerd in years. Overall, it is clear from the graph that Renewables had increased. In addition, Oil and Gas stayed the same throghout the period. Wereas Nuclear and coal decreased. According to what the figures show, the share of Renewables went from 15.0% in 2014 to 26.2% in 201…

Read full answer & analysis →

AI-completed learning example

203 words · Illustrative target band

The pie chart draws the colusion of the survey of that compares the energy generation by fuel type between the years of 2014 to 2018 Overall, between these duration the amount of oil and other and gas remained same throughout the years. The changes occured in the neculear, coal and renewable. Turning to the first chart, coal made up 28.4% of the energy in 2014, while gas was a little higher, at 30.1%. Renewable energ…

Read full answer & analysis →

AI-completed learning example

189 words · Illustrative target band

In both pie charts, discussion about energy generation by fuel types in two yeas 2014 and 2018 in UK. In this types oil and others, nuclear, gas, coal, and renewable energy generation by fuel types are entered. In 2014, coal energy generation by fuel type use is 28.4%, gas energy generation used is 30.1%, nuclear energy generation was 22.5%, and renewable was 15%, while oil and other is only 4%. In 2018, gas still us…

Read full answer & analysis →