



AI-completed learning example
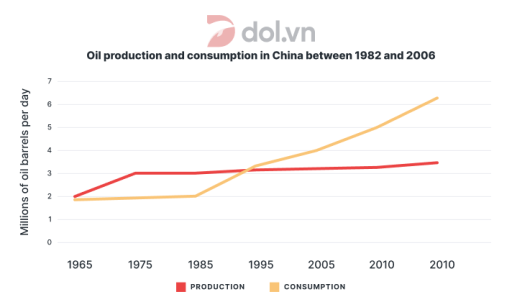
226 words · Illustrative target bandThe line chart illustrates the proportion of oil production and consumption in China among 1982 to 2006. Overall,it can be seen that oil consumption seems more dominant and preffered type in China there was a abrupt rise trend in consumption of China.However,production of oil slightly grow in throught the years. China of the expenditures remained unclear in the graph, because it does not show expenditures; it compare…
Read full answer & analysis →