



AI-completed learning example
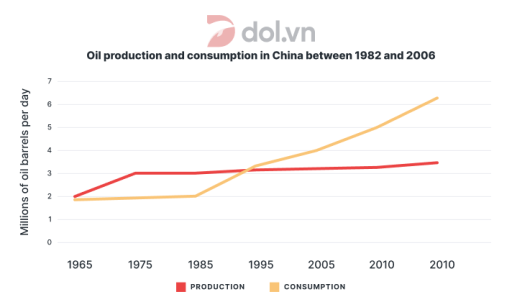
200 words · Illustrative target bandThis line graph provides information about the consumption and production of oil in China from 1982 to 2006.The data is measured in millions of oil barrels per day. Overall,there is an upward trend in both consumption and production of oil in China.But the consumption of oil increases very fast with the passage of time. In the first observation, production stands at about 2 million barrels per day, slightly above con…
Read full answer & analysis →