



AI-completed learning example
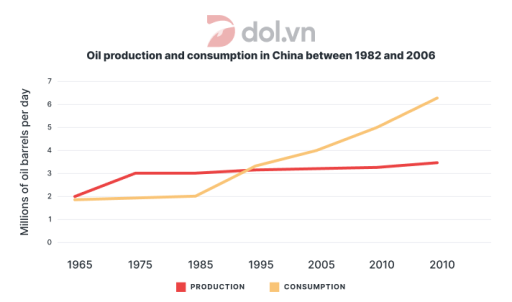
210 words · Illustrative target bandThe line graph illustrates the trends in oil production and consumption in China from 1982 to 2006, measured in millions of barrels per day. Overall, both production and consumption exhibit an upward trajectory, with consumption significantly outpacing production in the later years. In 1982, China’s oil production stood at 2 million barrels per day, showing the starting point for a subsequent modest rise. It then cli…
Read full answer & analysis →