



AI-completed learning example
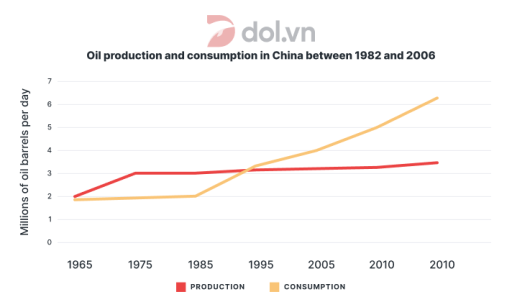
222 words · Illustrative target bandThe line graph illustrates the daily amount of oil consumed and produced in China from 1982 to 2006. It can clearly be seen that China saw increases in both oil production and consumption. However, there were differences in terms of the growth rate over the period surveyed. In 1982, Chinese people consumed and produced just under 2 million barrels per day in consumption and just under 3 million in production. These 1…
Read full answer & analysis →